FunCC
This page references the official documentation of FunCC.
Method Description
FunCC is a non-parametric, greedy bi-clustering algorithm for matrices whose entries are continuous curves. It extends the Cheng & Church strategy to the functional domain and optionally co-estimates curve alignment (phase registration). The key steps are summarized below.
Functional Data Representation Discrete observations are smoothed into continuous curves \(f_{ij}(t)\), forming an \(n \times m\) functional matrix.
Ideal Bi-Cluster Model & H-score
Within a bi-cluster \(B(I,J)\) each curve is modeled as
\[f_{ij}(t) = \mu(t) + \alpha_i(t) + \beta_j(t)\]where \(\mu\) is the cluster mean curve and \(\alpha_i,\beta_j\) capture row- and column-specific deviations. The H-score quantifies within-cluster dispersion via the average squared \(L^2\) distance to the fitted template.
Greedy Iterative Search (Functional Cheng & Church)
Multiple-node deletion: remove rows/columns whose contribution exceeds \(\theta \cdot H\).
Single-node deletion: iteratively drop the worst row/column until \(H < \delta\).
Node addition: re-introduce previously removed rows/columns that do not increase \(H\).
After a cluster is finalized, assigned elements are masked; Bimax locates the largest remaining sub-matrix and the process repeats.
Optional Curve Alignment
A shift warping \(w_{ij}(t)=t+q_{ij}\) is estimated per curve to minimize the squared \(L^2\) distance to the current template. Alignment and template updates iterate until convergence.
Parameter Tuning
\(\delta\) balances cluster quality vs. quantity.
\(\theta\) controls the aggressiveness of multiple-node deletion.
Visualization & Interpretation
FunCC outputs non-exhaustive, non-overlapping bi-clusters described by \(\mu(t)\) and row/column effects, revealing interpretable spatio-temporal patterns.
Function
This method provides four core functions: cc_sim_data, cc_bifunc, cc_bifunc_cv and FDPlot.cc_fdplot. In this section, we detail their respective usage, aswell as parameters, output values and usage examples for each function. Because the parameters of functions cc_bifunc and cc_bifunc_cv are similar while their outputs differ, we will explain the two functions together.
cc_sim_data
cc_sim_data loads simulated data according to the FunCC model.
cc_sim_data()
Parameter
The simulated data are loaded internally and have no adjustable parameters.
Value
An object of class array of dimension 30 x 7 x 240.
Example
from BiFuncLib.simulation_data import cc_sim_data
fun_mat = cc_sim_data()
cc_bifunc & cc_bifunc_cv
cc_bifunc performs model fitting, while cc_bifunc_cv selects the best delta for the algorithm.
cc_bifunc(data, delta, theta = 1, template_type = 'mean', number = 100,
          alpha = 0, beta = 0, const_alpha = False, const_beta = False,
          shift_alignment = False, shift_max = 0.1, max_iter_align = 100)
and
cc_bifunc_cv(data, delta_list, theta = 1.5, template_type = 'mean', number = 100,
             alpha = 0, beta = 0, const_alpha = False, const_beta = False,
             shift_alignment = False, shift_max = 0.1, max_iter_align = 100, plot = True)
Parameter
Parameter |
Description |
|---|---|
data |
array, the data array (n x m x T) where each entry corresponds to the measure of one observation i, i=1,…,n, for a functional variable m, m=1,…,p, at point t, t=1,…,T. |
delta (no cross validation) |
numeric, maximum of accepted score, should be a real value > 0. |
delta_list (with cross validation) |
list, a list of delta to be selected. |
theta |
numeric, scaling factor should be a real value > 1. |
template_type |
str, type of template required. If template_type=’mean’ the template is evaluated as the average function, if template_type=’medoid’ the template is evaluated as the medoid function. Default is ‘mean’. |
number |
integer, maximum number of iteration. Default is 100. |
alpha |
integer 1 or 0, if alpha=1 row shift is allowed, if alpha=0 row shift is avoided. Default is 0. |
beta |
integer 1 or 0, if beta=1 column shift is allowed, if beta=0 column shift is avoided. Default is 0. |
const_alpha |
bool, if True, row shift is contrained as constant. Default is False. |
const_beta |
bool, if True, column shift is contrained as constant. Default is False. |
shift_alignment |
bool, if True, the shift aligment is performed, if False no alignment is performed. Default is False. |
shift_max |
numeric between 0 and 1, controls the maximal allowed shift at each iteration, in the alignment procedure with respect to the range of curve domains. |
max_iter_align |
integer, maximum number of iteration in the alignment procedure. |
plot |
bool, whether to output graphs showing how each model metric changes with iterations. Default is True. |
Value
The function cc_bifunc outputs a dict including clustering results and information of the model.
Number: integer, the number of clustering groups.
RowxNumber: array of bool, a matrix contains row clustering results.
Numberxcol: array of bool, a matrix contains column clustering results.
Parameter: dict, a dict containing the parameters setting of the algorithm.
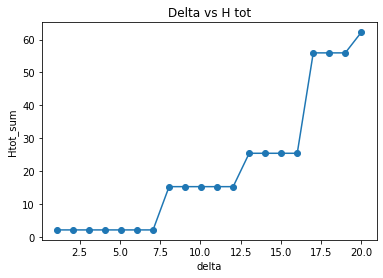
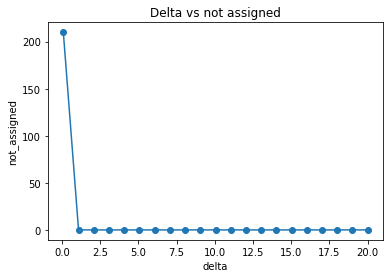
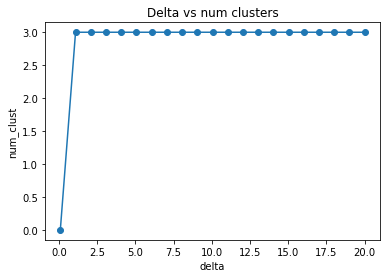
The function cc_bifunc_cv outputs a dataframe including each model metric changes with different delta. Users can select best parameter through the function. If plot=True, then the following graphs will be displayed:
Delta v.s. H score
Delta v.s. number of not assigned
Delta v.s. number of cluster
Example
import numpy as np
from BiFuncLib.simulation_data import cc_sim_data
from BiFuncLib.cc_bifunc import cc_bifunc, cc_bifunc_cv
delta_list = np.linspace(0.1, 20, num = 21)
fun_mat = cc_sim_data()
# Find best delta
cc_result_cv = cc_bifunc_cv(fun_mat, delta_list = delta_list, alpha = 1, beta = 0, const_alpha = True, plot = True)
# Without shift_alignment
cc_result_1 = cc_bifunc(fun_mat, delta = 10, alpha = 1, beta = 0, const_alpha = True, shift_alignment = False)
# With shift_alignment
cc_result_2 = cc_bifunc(fun_mat, delta = 10, alpha = 1, beta = 0, const_alpha = True, shift_alignment = True)
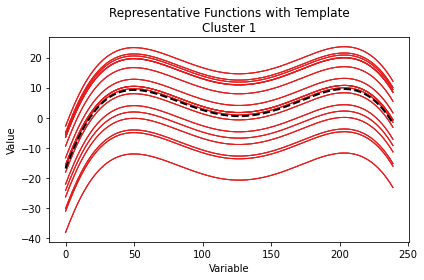
FDPlot.cc_fdplot
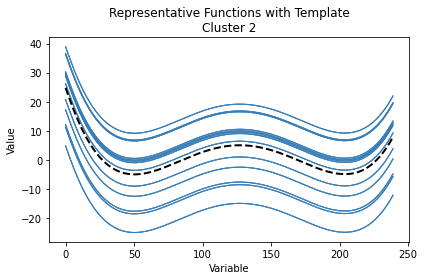
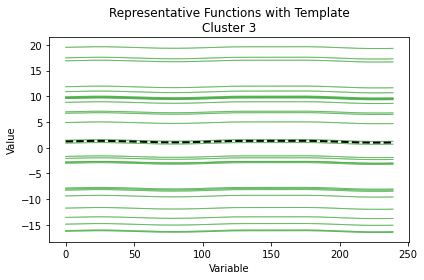
FDPlot.cc_fdplot displays the clustered function curves and provides options for mean subtraction, alignment, and warping.
FDPlot(result).cc_fdplot(data, only_mean = False, aligned = False, warping = False)
Parameter
Parameter |
Description |
|---|---|
result |
dict, a clustering result generated by cc_bifunc function. |
data |
array, same as in cc_bifunc. |
only_mean |
bool, if True, only the template functions for each bi-cluster is displayed. Default is False. |
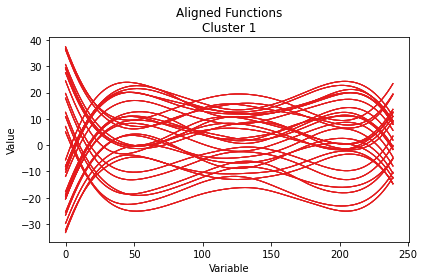
aligned |
bool, if True, the aligned functions are displayed. Default is False. |
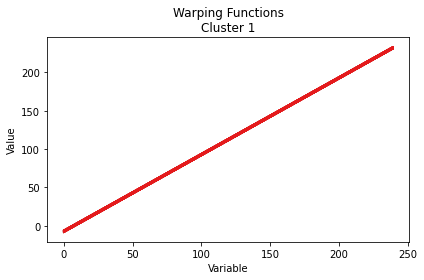
warping |
bool, if True, a figure representing the warping functions are displayed. Default is False. |
Value
Here we illustrate the outputs of the plot function in different settings.
cluster results
|
|
|
aligned function
warping function
Example
import numpy as np
from BiFuncLib.FDPlot import FDPlot
from BiFuncLib.simulation_data import cc_sim_data
from BiFuncLib.cc_bifunc import cc_bifunc, cc_bifunc_cv
delta_list = np.linspace(0.1, 20, num = 21)
fun_mat = cc_sim_data()
# Find best delta
cc_result_cv = cc_bifunc_cv(fun_mat, delta_list = delta_list, alpha = 1, beta = 0, const_alpha = True, plot = True)
# Without shift_alignment
cc_result_1 = cc_bifunc(fun_mat, delta = 10, alpha = 1, beta = 0, const_alpha = True, shift_alignment = False)
FDPlot(cc_result_1).cc_fdplot(fun_mat, only_mean = True, aligned = False, warping = False)
# With shift_alignment
cc_result_2 = cc_bifunc(fun_mat, delta = 10, alpha = 1, beta = 0, const_alpha = True, shift_alignment = True)
FDPlot(cc_result_2).cc_fdplot(fun_mat, only_mean = False, aligned = True, warping = True)