CVX
Method Description
Sparse Data Representation
Convex Biclustering operates on high-dimensional data matrices where rows typically represent samples (e.g., subjects) and columns represent variables (e.g., genes). The data matrix is often centered to ensure that each column has zero mean. This preprocessing step helps in identifying interpretable patterns by removing the overall mean effect.
Model Definition
Convex Biclustering seeks to identify groups of rows and columns in a data matrix that are associated with each other. The goal is to partition the matrix into a checkerboard pattern, where each block represents a bicluster. The model assumes that the observed data matrix \(X \in \mathbb{R}^{p \times n}\) can be approximated by a mean matrix \(U\) with a checkerboard structure. Specifically, the model aims to minimize the following convex criterion:
\[F_\gamma(U) = \frac{1}{2} \|X - U\|_F^2 + \gamma \left( \sum_{i < j} w_{ij} \|U_{\cdot i} - U_{\cdot j}\|_2^2 + \sum_{i < j} \tilde{w}_{ij} \|U_{i \cdot} - U_{j \cdot}\|_2^2 \right),\]
where \(\| \cdot \|_F\) denotes the Frobenius norm, \(w_{ij}\) and \(\tilde{w}_{ij}\) are non-negative weights, and \(\gamma \geq 0\) is a regularization parameter that controls the trade-off between the goodness-of-fit and the complexity of the biclustering.
Iterative Algorithm for Computation (COBRA)
The Convex Biclustering problem is solved using the Convex BiclusteRing Algorithm (COBRA), which is an iterative algorithm based on the Dykstra-like proximal algorithm (DLPA). The steps are as follows:
Initialization: Set \(U^{(0)} = X\), \(P^{(0)} = 0\), and \(Q^{(0)} = 0\).
Iterate: - Convex Clustering of Rows: \(Y^{(m)} = \text{prox}_{\gamma \tilde{W}}(U^{(m)T} + P^{(m)T})\) - Update \(P^{(m+1)} = U^{(m)} + P^{(m)} - Y^{(m)T}\) - Convex Clustering of Columns: \(U^{(m+1)} = \text{prox}_{\gamma W}(Y^{(m)T} + Q^{(m)T})\) - Update \(Q^{(m+1)} = Y^{(m)} + Q^{(m)} - U^{(m+1)T}\)
Convergence Check: Repeat the updates until convergence, typically when \(\|U^{(m)} - Y^{(m)}\|_F\) falls below a tolerance \(\tau > 0\).
The proximal mapping \(\text{prox}_{\gamma W}(Z)\) is defined as:
\[\text{prox}_{\gamma W}(Z) = \arg \min_V \left\{ \frac{1}{2} \|Z - V\|_F^2 + \gamma \sum_{i < j} w_{ij} \|V_{\cdot i} - V_{\cdot j}\|_2^2 \right\}\]
Penalty Parameter Selection
The regularization parameter \(\gamma\) controls the number of biclusters and the complexity of the solution. To select \(\gamma\) in a data-driven manner, we use a hold-out validation approach. A subset of the data matrix is randomly selected as a validation set, and the model is evaluated on how well it predicts the hold-out set. The optimal \(\gamma\) is chosen to minimize the prediction error over the hold-out set.
Post-processing for Interpretation
After obtaining the biclustering solution \(U_\gamma\), the resulting matrix can be reordered to reveal the checkerboard pattern. The biclusters can be visualized using heatmaps, where each block corresponds to a bicluster. This visualization helps in interpreting the relationships between different groups of samples and variables.
Function
This method provides three core functions: cvx_sim_data, cvx_biclus_missing and cvx_biclus_valid. For modeling, The cvx_biclus_missing function performs convex biclustering on incomplete data matrices using an MM algorithm, while cvx_biclus_valid serves as an MM algorithm wrapper for parameter selection. Both functions have built-in plotting parameters that can output graphs of the clustering results, and cvx_biclus_valid can additionally display a graph of the validation error as a function of γ.
cvx_sim_data
cvx_sim_data loads a data matrix according to the CVX model.
cvx_sim_data()
Parameter
The simulated data are loaded internally and have no adjustable parameters.
Value
A data matrix of dimension 100 x 56. (dataframe)
Example
from BiFuncLib.simulation_data import cvx_sim_data
cvx_simdata = cvx_sim_data()
gkn_weights
Before introducing the modeling functions, we introduce gkn_weights, which combines Gaussian kernel weights with k-nearest neighbor weights.
gkn_weights(X, phi=0.5, k_row=5, k_col=5)
Parameter
Parameter |
Description |
|---|---|
X |
dataframe, the data matrix to be clustered. The rows are the features, and the columns are the samples.. |
phi |
numeric, the nonnegative parameter that controls the scale of kernel weights. Default is 0.5. |
k_row |
integer, The number of row nearest neighbors. Default is 5. |
k_col |
integer, the number of column nearest neighbors. Default is 5. |
Value
The function gkn_weights outputs a dict contains parameters E_row, E_col, w_row and w_col. Detailed explanations for these entries will be provided in the modeling functions below.
Example
from BiFuncLib.cvx_main_func import gkn_weights
wts = gkn_weights(data, phi=phi, k_row=k, k_col=k)
w_row = wts["w_row"]
w_col = wts["w_col"]
E_row = wts["E_row"]
E_col = wts["E_col"]
cvx_biclus_missing
cvx_biclus_missing(data, E_row, E_col, w_row, w_col, gam, Lambda_row, Lambda_col, Theta, max_iter=100,
                   tol=1e-3, max_iter_inner=1000, tol_inner=1e-4, plot_clus = True)
Parameter
Parameter |
Description |
|---|---|
data |
dataframe, the data matrix to be clustered. The rows are the features, and the columns are the samples. |
E_row |
sparse.csc.csc_matrix, edge-incidence matrix for row graph. |
E_col |
sparse.csc.csc_matrix, edge-incidence matrix for column graph. |
w_row |
array, vector of weights for row graph. |
w_col |
array, vector of weights for column graph. |
gam |
integer, path parameters and structures. |
Lambda_row |
array, initial guess of row Langrage multipliers. |
Lambda_col |
array, initial guess of column Langrage multipliers. |
Theta |
list, a list of missing indices. |
max_iter |
integer, maximum number of iterations. Default is 100. |
tol |
numeric, stopping criterion. Default is 1e-3. |
max_iter_inner |
integer, maximum number of inner cobra iterations. Default is 1000. |
tol_inner |
numeric, stopping criterion for inner cobra loop. Default is 1e-4. |
plot_clus |
bool, whether to plot clustering results. Default is True. |
Value
The function cvx_biclus_missing outputs a dict contains clustering results and parameters.
iter: integer, the current iteration number of the algorithm.
Lambda_col: array, a matrix of regularization parameters for column clustering across different iterations.
Lambda_row: array, a matrix of regularization parameters for row clustering across different iterations.
mm_loss: list, the loss values from the model at different iterations.
nu_col: numeric, a parameter or statistic related to column clustering, possibly a normalization factor.
nu_row: numeric, a parameter or statistic related to row clustering, possibly a normalization factor.
U: array, a matrix representing the estimated mean values, possibly including imputed values for missing data.
V_col: array, a matrix representing the column-wise clustering assignments or indicators.
V_row: array, a matrix representing the row-wise clustering assignments or indicators.
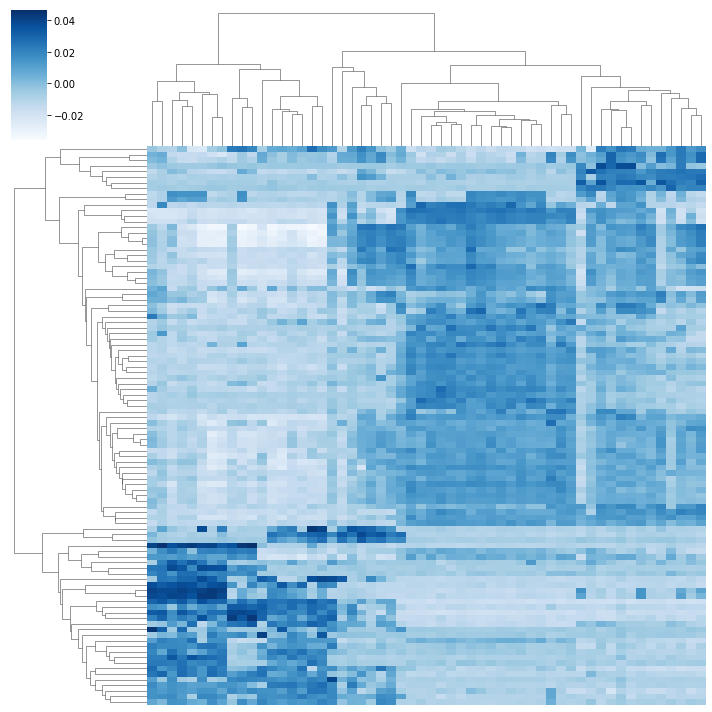
Also, when plot_clus=True, it displays the clustering results.
Example
import numpy as np
import random
import math
from BiFuncLib.simulation_data import cvx_sim_data
from BiFuncLib.cvx_main_func import gkn_weights
from BiFuncLib.cvx_biclus import cvx_biclus_valid, cvx_biclus_missing
cvx_simdata = cvx_sim_data()
X = cvx_simdata.copy()
X = X - np.mean(np.mean(X))
X = X / np.linalg.norm(X, 'fro')
data = X
phi = 0.5
k = 5
print("=== Example 1 ===")
wts = gkn_weights(X, phi=phi, k_row=k, k_col=k)
E_row = wts["E_row"]
E_col = wts["E_col"]
gam = 200
m_row = E_row.shape[0]
m_col = E_col.shape[0]
n = X.shape[1]
p = X.shape[0]
Lambda_row = np.random.randn(n, m_row)
Lambda_col = np.random.randn(p, m_col)
Theta = random.sample(range(1, n*p+1), math.floor(0.1 * n * p))
wts = gkn_weights(data, phi=phi, k_row=k, k_col=k)
w_row = wts["w_row"]
w_col = wts["w_col"]
E_row = wts["E_row"]
E_col = wts["E_col"]
cvx_res1 = cvx_biclus_missing(data, E_row, E_col, w_row, w_col, gam, Lambda_row, Lambda_col, Theta)
cvx_biclus_valid
cvx_biclus_valid(data, E_row, E_col, w_row, w_col, gamma, Lambda_row=None, Lambda_col=None,
                 fraction=0.1, max_iter=100, tol=1e-3, max_iter_inner=1000, tol_inner=1e-4,
                 smooth = False, plot_error = True, plot_clus = True)
Parameter
Parameter |
Description |
|---|---|
data |
dataframe, the data matrix to be clustered. The rows are the features, and the columns are the samples. |
E_row |
sparse.csc.csc_matrix, edge-incidence matrix for row graph. |
E_col |
sparse.csc.csc_matrix, edge-incidence matrix for column graph. |
w_row |
array, vector of weights for row graph. |
w_col |
array, vector of weights for column graph. |
gamma |
array, a sequence of regularization parameter for shrinkage. |
Lambda_row |
array, initial guess of row Langrage multipliers. |
Lambda_col |
array, initial guess of column Langrage multipliers. |
fraction |
numeric, fraction of entries for hold out. |
max_iter |
integer, maximum number of iterations. Default is 100. |
tol |
numeric, stopping criterion. Default is 1e-3. |
max_iter_inner |
integer, maximum number of inner cobra iterations. Default is 1000. |
tol_inner |
numeric, stopping criterion for inner cobra loop. Default is 1e-4. |
smooth |
bool, whether to smooth the clustering results. Default is False. |
plot_error |
bool, whether to plot a graph of the validation error as a function of γ. Default is True. |
plot_clus |
bool, whether to plot clustering results. Default is True. |
Value
The function cvx_biclus_valid outputs a dict contains clustering results and parameters.
groups_col: list, a list containing cluster assignments and sizes for columns.
groups_row: list, a list containing cluster assignments and sizes for rows.
ThetaM: array, a matrix representing the row cluster centroids.
ThetaV: array, a matrix representing the column cluster centroids.
U: list, a list of matrices representing the estimated mean matrix for each iteration of the algorithm.
V_col: list, a list of matrices representing the column-wise clustering assignments.
V_row: list, a list of matrices representing the row-wise clustering assignments.
validation_error: array, an array storing the validation errors for different values of the regularization parameter γ.
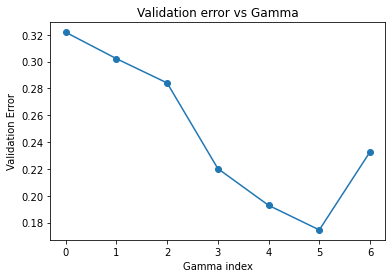
When plot_error=True, it displays:
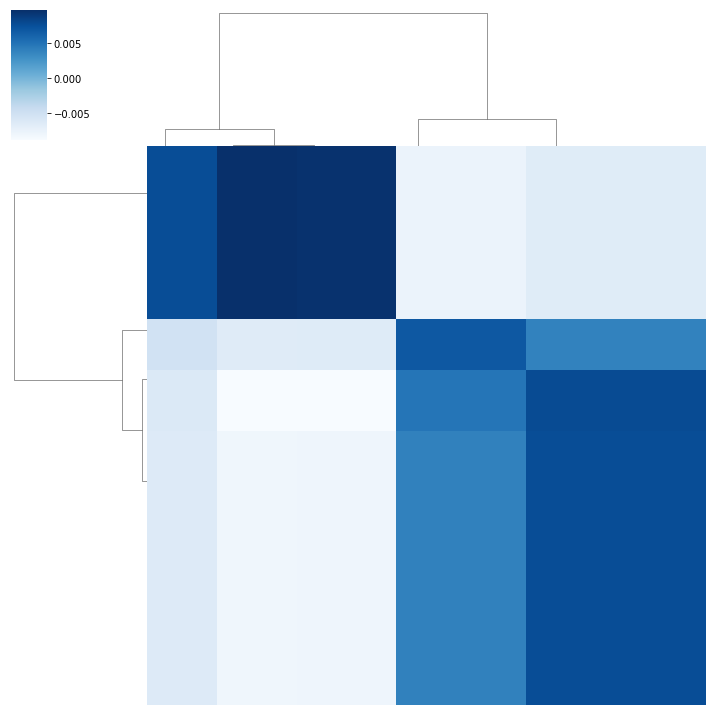
When plot_clus=True and smooth=False, it displays:
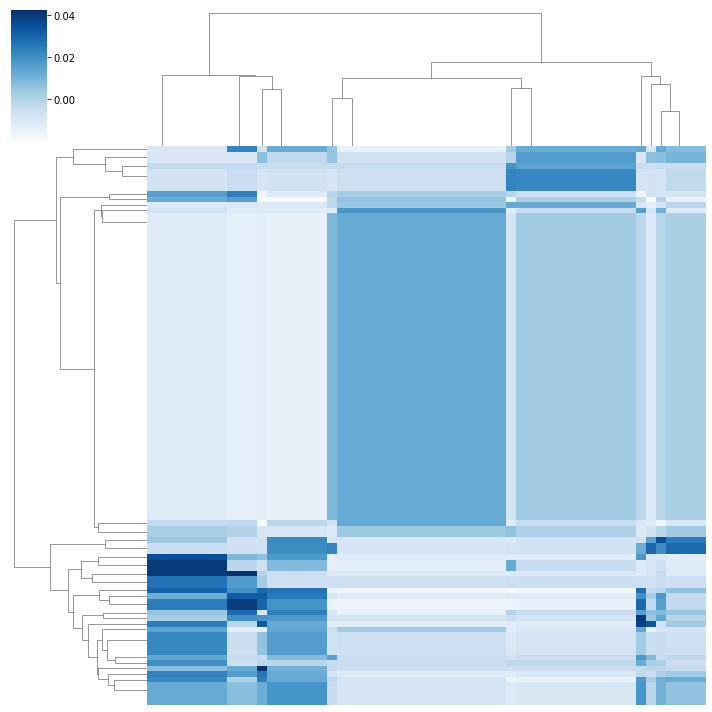
When plot_clus=True and smooth=True, it displays:
Example
import numpy as np
import random
import math
from BiFuncLib.simulation_data import cvx_sim_data
from BiFuncLib.cvx_main_func import gkn_weights
from BiFuncLib.cvx_biclus import cvx_biclus_valid, cvx_biclus_missing
cvx_simdata = cvx_sim_data()
X = cvx_simdata.copy()
X = X - np.mean(np.mean(X))
X = X / np.linalg.norm(X, 'fro')
data = X
phi = 0.5
k = 5
print("=== Example 2 ===")
nGamma = 5
gammaSeq = 10 ** np.linspace(0, 3, nGamma)
wts = gkn_weights(data, phi=phi, k_row=k, k_col=k)
w_row = wts["w_row"]
w_col = wts["w_col"]
E_row = wts["E_row"]
E_col = wts["E_col"]
cvx_res2 = cvx_biclus_valid(data, E_row, E_col, w_row, w_col, gammaSeq, plot_error = False)
print("=== Example 3 ===")
nGamma = 7
gammaSeq = 10 ** np.linspace(0, 1, nGamma)
cvx_res3 = cvx_biclus_valid(data, E_row, E_col, w_row, w_col, gammaSeq, smooth = True)
Previous: SSVD | Next: References