Bimax
Method Description
Bimax is a simple reference model for biclustering gene-expression data.
Binary Data Representation
Continuous log-expression values are mean-centered and thresholded (e.g. 2-fold change) to build a sparse 0/1 matrix. A value 1 indicates that the gene “responds” in the given condition.
Model Definition (Inclusion-Maximal Biclusters)
A bicluster (G,C) is a maximal submatrix of E whose entries are all 1 and that is not contained in any larger such submatrix. The task is to enumerate every inclusion-maximal bicluster.
Divide-and-Conquer Inference (Bimax Algorithm)
Instead of brute-force enumeration, the matrix is recursively split along all-zero regions that can be safely discarded. The recursion stops when the current submatrix is entirely 1’s, at which point it is output as a bicluster.
Post-processing for Fair Comparison
Because competing methods return very different numbers of biclusters, a greedy filter is applied: iteratively select the largest remaining bicluster that overlaps < 25 % with any previously selected one, continuing until 100 biclusters (or the known ground-truth number for synthetic data) are retained.
Function
This method provides three core functions: bimax_sim_data, bimax_biclus and bcheatmap. The bcheatmap function can also be applied to other scalar clustering algorithms. In this section, we detail their respective usage, as well as parameters, output values and usage examples for each function.
bimax_sim_data
bimax_sim_data loads a binary matrix according to the Bimax model.
bimax_sim_data()
Parameter
The simulated data are loaded internally and have no adjustable parameters.
Value
A binary matrix of dimension 100 x 50.
Example
from BiFuncLib.simulation_data import bimax_sim_data
bimax_simdata = bimax_sim_data()
bimax_biclus
bimax_biclus performs model fitting.
bimax_biclus(matrix, minr=2, minc=2, number=100)
Parameter
Parameter |
Description |
|---|---|
matrix |
array, the pre-thresholded binary expression matrix where 1 indicates a gene responds under a condition. |
minr |
integer, minimal numbers of rows an inclusion-maximal all-1 submatrix must contain to be reported, filtering out tiny biclusters. |
minc |
integer, minimal numbers of columns an inclusion-maximal all-1 submatrix must contain to be reported, filtering out tiny biclusters. |
number |
integer, maximum biclusters returned after duplicate removal, set to 100 in the paper for fair cross-method comparison. |
Value
The function bimax_biclus outputs a BiclustResult object defined within the package. The key results are feature_cluster and sample_cluster, and we omitted the outputs that are identical to the inputs.
params: dict, stores the user-supplied parameter dict (minr, minc, number, etc.).
RowxNumber: array, binary matrix indicating which rows belong to which of the K row clusters (1 = member, 0 = non-member).
NumberxCol: array, transposed binary matrix indicating which columns belong to which of the L column clusters.
Number: integer, total number of biclusters returned after filtering,
cluster_row_sizes: integer, the number of rows assigned to each row cluster (obtained as column sums of RowxNumber).
cluster_col_sizes: integer, the number of columns assigned to each column cluster (obtained as column sums of NumberxCol).
Example
from BiFuncLib.simulation_data import bimax_sim_data
from BiFuncLib.bimax_biclus import bimax_biclus
bimax_simdata = bimax_sim_data()
bimax_res = bimax_biclus(bimax_simdata, minr=4,minc=4,number=10)
bcheatmap
bcheatmap visualizes the scalar clustering result in the form of a heatmap.
bcheatmap(X, res, cexR=1.5, cexC=1.25, axisR=False, axisC=True, heatcols=None, clustercols=None,
          allrows=False, allcolumns=True)
Parameter
Parameter |
Description |
|---|---|
X |
array, the matrix needs to be clustered. |
res |
BiclustResult object, the biclustering result object containing information about row and column assignments to biclusters. |
cexR |
numeric, the font size of row labels. Default is 1.5. |
cexC |
numeric, the font size of column labels. Default is 1.25. |
axisR |
bool, whether to show row labels on the heatmap. Default is False. |
axisC |
bool, whether to show column labels on the heatmap. Default is True. |
heatcols |
str or none, color palette for the heatmap. Default is None which stands for a diverging blue-white-red palette. |
clustercols |
list or none, list of colors for outlining biclusters on the heatmap. Default is a list of distinct colors. |
allrows |
bool, whether to include all rows in the heatmap, even those not assigned to any bicluster. Default is False. |
allcolumns |
bool, whether to include all columns in the heatmap, even those not assigned to any bicluster. Default is True. |
Value
A heatmap will be displayed to show the clustering result.
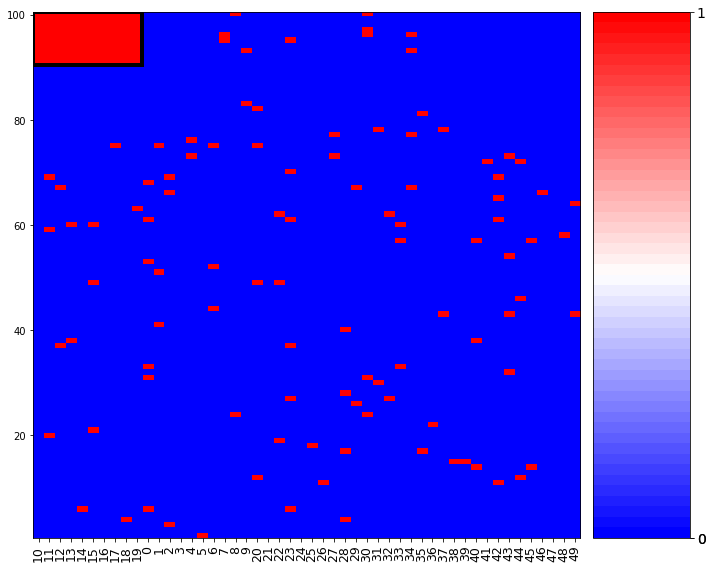
Example
from BiFuncLib.simulation_data import bimax_sim_data
from BiFuncLib.bimax_biclus import bimax_biclus
from BiFuncLib.bcheatmap import bcheatmap
bimax_simdata = bimax_sim_data()
bimax_res = bimax_biclus(bimax_simdata, minr=4,minc=4,number=10)
bcheatmap(bimax_simdata,bimax_res)